Leaflet is fantastic. One of the more interesting use cases I've seen for it is the Guild Wars 2 wiki. They use it heavily to display the game map for regions, areas of interests etc. It's quite impressive, and very useful as a player!
If you're looking for an actual demo of the product, it seems that the weather map on https://www.msn.com/en-us/weather/maps?lat=47.6032&lon=-122.... is powered by leaflet. I really like the work they've done with the wind animations and historical air quality maps
In a previous life I used Leaflet in some digital art-history publications for the Getty Museum in LA [1]. Leaflet was the MVP of our static-website software stack ("JAMstack" before that was a thing). We used Leaflet to provide maps of the Roman Empire as well as deep-zoom functionality for images of artwork. The library is a gem of open-source web technology, versatile and reliable.
The first time I used it was to map parks and facilities for a state parks department, must have been in the early 2010s?
The design and data called for thousands of nested POIs all searchable by a range of filters (facilities, activities, etc), with pop-up info boxes and automatic clustering groups, with a custom layer from their XML-based geoserver full of park boundaries (polygons) which could filter the POIs within. By design this all required a round-trip to their geoserver which did a spatial query. The specification pushed one of the more popular JS mapping heavyweights of the day (I forget which) which due to the specific mix of required features ended up being painful, slow, janky, and with mobile-responsive becoming the frontend de-jure, a battle against nested layers of opinionated templating abstractions, all of which added up to a couple of hundred KB of dependencies and endless fragile callback-induced race-conditions, slow round-trips to their geoserver, and XML parsing issues. The mapping became a blocker on the project as the weeks wore on - hammer down one gopher, and another head would pop up. Design compromises were being considered to get the job over the line.
Enter Leaflet which was considered risky and new at the time, but on a whim and my own time I threw together a quick demo and got permission to spend a few days on it. I replaced weeks of frustrating spaghetti code and rebuilt a faster and more stable solution in a couple of days, polished it up after getting the "nod" and the site was finally ready to launch a couple of days later. Leaflet enabled the solution by being compact, only did the thing it was designed to do and didn't interfere elsewhere, and the plugins were tiny, did their job, and did it much more transparently. The main thing I had to do was transform their XML into GeoJSON on our webserver (their backend had only rudimentary GeoJSON support at the time - I think their internal teams either refused or were not allowed to update it?).
Anyway didn't mean to write a mini-blog post shilling Leaflet, it's a great library, my first experience of it was that it saved a seemingly doomed project, it does exactly what it says on the box and not much else, which is perfect when it's just a small component of a much larger and more complex project. It's my first go-to for interactive map rendering and even non-map stuff, like zoomable gigapixel photos.
I have used this and it is excellent. It is a tremendous alternative to all the paid GIS/mapping suites.
I’ve used Leaflet a ton and love it. But I recently tried using it with a vector-based render method (as opposed to the rastered tiles Leaflet uses by default) and couldn’t find anything that worked anywhere near as easily and simply as Leaflet’s standard rendering.
I don’t blame the Leaflet folks for this really, rendering map data locally via WebGL is not a simple task. But it’s been depressing to see folks like MapBox close off their vector-based library (and Google’s isn’t open either). There’s an open source of Mapbox’s library but it still feels like the open source world is being left out in the cold compared to how things were just a few years ago.
LeafletJS is not just limited to mapping applications, it is used in LibreOffice online [1] to present pixmaps of rendered documents in the web client.
[1] https://git.libreoffice.org/online/+/master/loleaflet/README
There are many projects displaying georeferenced photographs using Leaflet, which usually work via precalculated hotspots in image- and mapview. Here's a project that uses photogrammetry to link not just some but all points. Clicking the photograph zooms into the corresponding position in the Leaflet-view and vice-versa.
Some past related threads:
How to Make Maps Using Leaflet.js, PostGIS and Chicago Open Data - https://news.ycombinator.com/item?id=19784355 - April 2019 (20 comments)
Leaflet – A JavaScript library for mobile-friendly interactive maps - https://news.ycombinator.com/item?id=16149725 - Jan 2018 (36 comments)
Leaflet: An open-source JavaScript library for mobile-friendly interactive maps - https://news.ycombinator.com/item?id=13095390 - Dec 2016 (71 comments)
Leaflet 1.0 – A JavaScript library for mobile-friendly interactive maps - https://news.ycombinator.com/item?id=12589447 - Sept 2016 (99 comments)
D3 and Leaflet maps (2012) - https://news.ycombinator.com/item?id=11017763 - Feb 2016 (8 comments)
Show HN: Lens Battle – Make comparing lenses easier (with leaflet.js) - https://news.ycombinator.com/item?id=10279358 - Sept 2015 (11 comments)
Show HN: Quizzity – a geographical quiz built on top of a Leaflet map - https://news.ycombinator.com/item?id=8981162 - Feb 2015 (6 comments)
Show HN: Traverse City Platmap with Leaflet and D3 - https://news.ycombinator.com/item?id=8164315 - Aug 2014 (6 comments)
Testing web map APIs – Google vs OpenLayers vs Leaflet - https://news.ycombinator.com/item?id=7451375 - March 2014 (12 comments)
Show HN: Earthquakes on Leaflet, Crossfilter and D3 - https://news.ycombinator.com/item?id=5157054 - Feb 2013 (7 comments)
Leaftlet - A Lightweight JavaScript Library for Interactive Maps - https://news.ycombinator.com/item?id=2746178 - July 2011 (21 comments)
https://github.com/mourner/projects
The above is a list of awesome open source projects Vladimir Agafonkin is involved in.
Vlad's "Earcut" triangulator - embedded in Three.js - and his solar calculator are efforts that have helped me a lot.
I am wondering: have Vlad and Ricardo Cabello AKA "Mr.doob" ever hacked some linear algebra together??
Super handy library. I used it for a real-time collaborative map tool [1], it's especially useful when it comes to customization, plus it has many plugins which add a lot of functionality. Leaflet Geoman [2] for instance is great for creating all sorts of geometries on the map, I've personally used it for my tool so users can designate areas and paths. So good.
Just a heads up, if you are looking into using this in your project: The popup onclick triggers are currently broken in the latest version under Safari, using an older version solves it.
Other than that this is an awesome library with tons of great plugins that I’ve used for years now.
https://automuseums.info/ is using leaflet, it is also doing some server side geoclustering. It's a mostly out of the box Drupal 9 site, there's custom code but very very little.
It's pretty awesome and works well, I've used it to test Spatialite.
My only wish is that I want to generate my own raster tiles, but I've seen that planet.osm now is 1.4TB, although the .PBF is only about 60GB.
I wish I could generate tiles of areas I want, but it seems the software requirements are pretty big, I'd rather use spatialite than postGIS, and I have no idea how to generate those tiles. There are a lot of GIS softwares, and most of them are pretty heavy, not to mention there are a lot of different formats which bloats everything.
For all you React users (Reactionaries?) out there, there's React Leaflet. I'm in the process of making a little React portfolio app that randomly generates airports within a user-defined distance of each other (for all the indecisive Flight Sim users), and with this library it took all of about 20 minutes to put the airports on a map, draw a line between them, and center the map on them. Really neat stuff.
Leaflet rocks! We use it for https://legendkeeper.com, CRDT-backed knowledge management for RPG game-masters.
A great library. I use it daily for web work. But recently I used it in an ionic framework mobile app. Simple cross-platform mobile map from a single code base? Yes please!
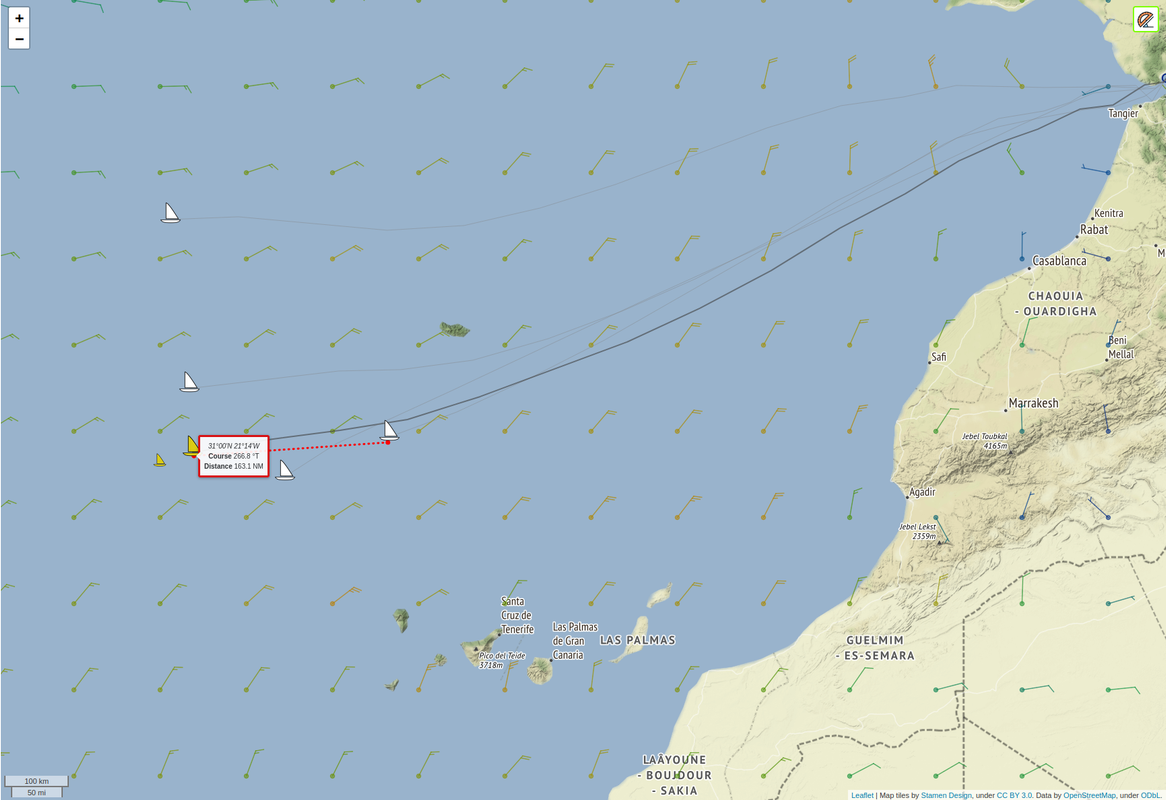
LeafletJS is great! I've been using it successfully with multiple tile layers and a few additional plugins as well (such as leaflet-ruler[0] and RotatedMarker[1]) as the foundation for the map display in my virtual sailing project. Here's a sample of what that looks like: https://i.postimg.cc/8z7DMz3T/leaflet-sample.png
Looks like the pixels it’s painting on my iPhone are double size, 2x2 squares. I might have some weird experimental WebKit features enabled or something but is that an easy mistake to make with Canvas? I suppose so.
This has nothing to do with JS but if you’re looking for something similar for Python I suggest Folium [1] which uses Leaflet.js to render maps on Jupyter notebooks. You can preview the end result here [2] [1]: https://github.com/python-visualization/folium [2]: https://python-visualization.github.io/folium/quickstart.htm...
LeafletJS looks great, but what's the advantage of using it instead of Deck.GL? LeafletJS doesn't seem to support WebGL rendering, while Deck.GL does
How does it compare to this?
Leaflet is great for a lot of rudimentary mapping online (99% of what people need). If you’re doing heavier WebGIS I encourage looking at OpenLayers.
I’m working on a writing prep web app that will have an interactive map feature. How nice for this to show up on the hn front page, I assumed I’d be making something custom in threejs until now.
It’s called plotbinder - the app and it’s website (plotbinder.com, currently nothing is hosted) should go online sometime in September
Leaflet for R is fantastic as well. It has been a while since I have used R so there might be something better now, but I have fond memories of that package.
This is used on https://55pl.us/find/ if you want to see it live
One thing question that I have. If I want to use an image as a source of my tiles. Should I split the image into chunks to load them when user moves the map around? Or is there any other way to do that? Are there any tools that would help split an image into those chunks?
Demonstration of splitting a polygon (GIS concept) using Leaflet: https://gavinr.github.io/split-polygon-demo/
Leaflet is great for polygon annotations. It is used by Labelbox and Supervisely.
Having worked with leaflet extensively it's a pleasure to use. I've never encountered something I couldn't accomplish in the framework.
I used leaflet for a previous project involving maps of users (https://tagmap.io/tag/slatestarcodex is an example of one), and my experience with it was wonderful; I'd be happy to use it again next time the need arises. The best part about it for me was perhaps how easily configurable it is, including easily adding additional plugins (for example, we used one called MarkerCluster to cluster markers for users if there were hundreds or thousands in the same area. Changing the style of markers, adding new ones, and so on, was also trivial). Nice library and experience in general.
I've done a couple of projects for clients with google maps - what's the advantages/disadvantages of using this?
There’s also react-leaflet for React components
Cool to see leaflet mentioned as I’ve been using it this week :P
I know someone that has used this for quite some time.
It’s an excellent library.
I'm the original author of Leaflet, ask me anything! Very happy every time I see it shared on the HN frontpage.
If you're curious about the story behind Leaflet and how and why it was born 10 years ago, here's a short 13-minute presentation on this: https://youtu.be/NLbyHffKQuU